Time advances to next period. Discounting happens across these nodes.

Agent recieves income x, in terms of units of current period consumption. In simple search models, we can assume that the agent immediately consumes this income.

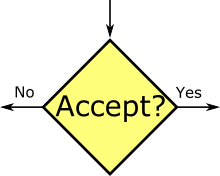
The agent makes a decision based on the current state variables.
Most of the work in these problems comes from characterizing these nodes and essentially reducing them to chance nodes.

A random event occurs. Branchs are labelled with the probability of each outcome.

The state variables are updated in some way not covered by the above. For example, a variable might be randomly redrawn, or reduced by 1.

This is not a node. It is a label for the present value in the state marked by the dot. Present value labels can either be singular or a function of state variables.
\(V^X_Y(Z)\) is the present value at state \(S^X_Y(Z)\)